
ESClient loginClients

Neural,iA

Intelligence is standard. Relevance is everything.

We anticipate how your audience will react before you say a word.

Multilevel Bayesian inferenceSynthetic audience panel built on each country's official dataMargin of error measured against real peoplePrivacy: aggregate data only

Access link

To explore the methodology and the data layer. The link is personal and valid for 24 hours.

// How it works

from data to decision.

What used to take weeks, you now get in hours. And you know how certain each result is.

  1. 01 · Connect

    We connect your data.

    We bring what you already know about your audience (surveys, sales, CRM/ERP, complaints, market research) together in one place with official data from your country. Every data point shows where it came from, and only you can see what’s yours.

    // Method 50 public sources in three layers · official censuses, area by area · online conversation, always aggregated · fingerprinted provenance · per-client isolation inside the database · See the data layer →

  2. 02 · Replicate

    We build your synthetic audience.

    Thousands of synthetic personas with the same mix of age, education, work and income as your real audience, area by area or segment by segment. Nothing is made up, and no real person is copied.

    // Method synthetic populations from official censuses (Beckman, Baggerly & McKay, 1996) · iterative proportional fitting (Deming & Stephan, 1940) · income from official household surveys · matches official data within half a percentage point · aggregated data only, in line with each country’s personal data law

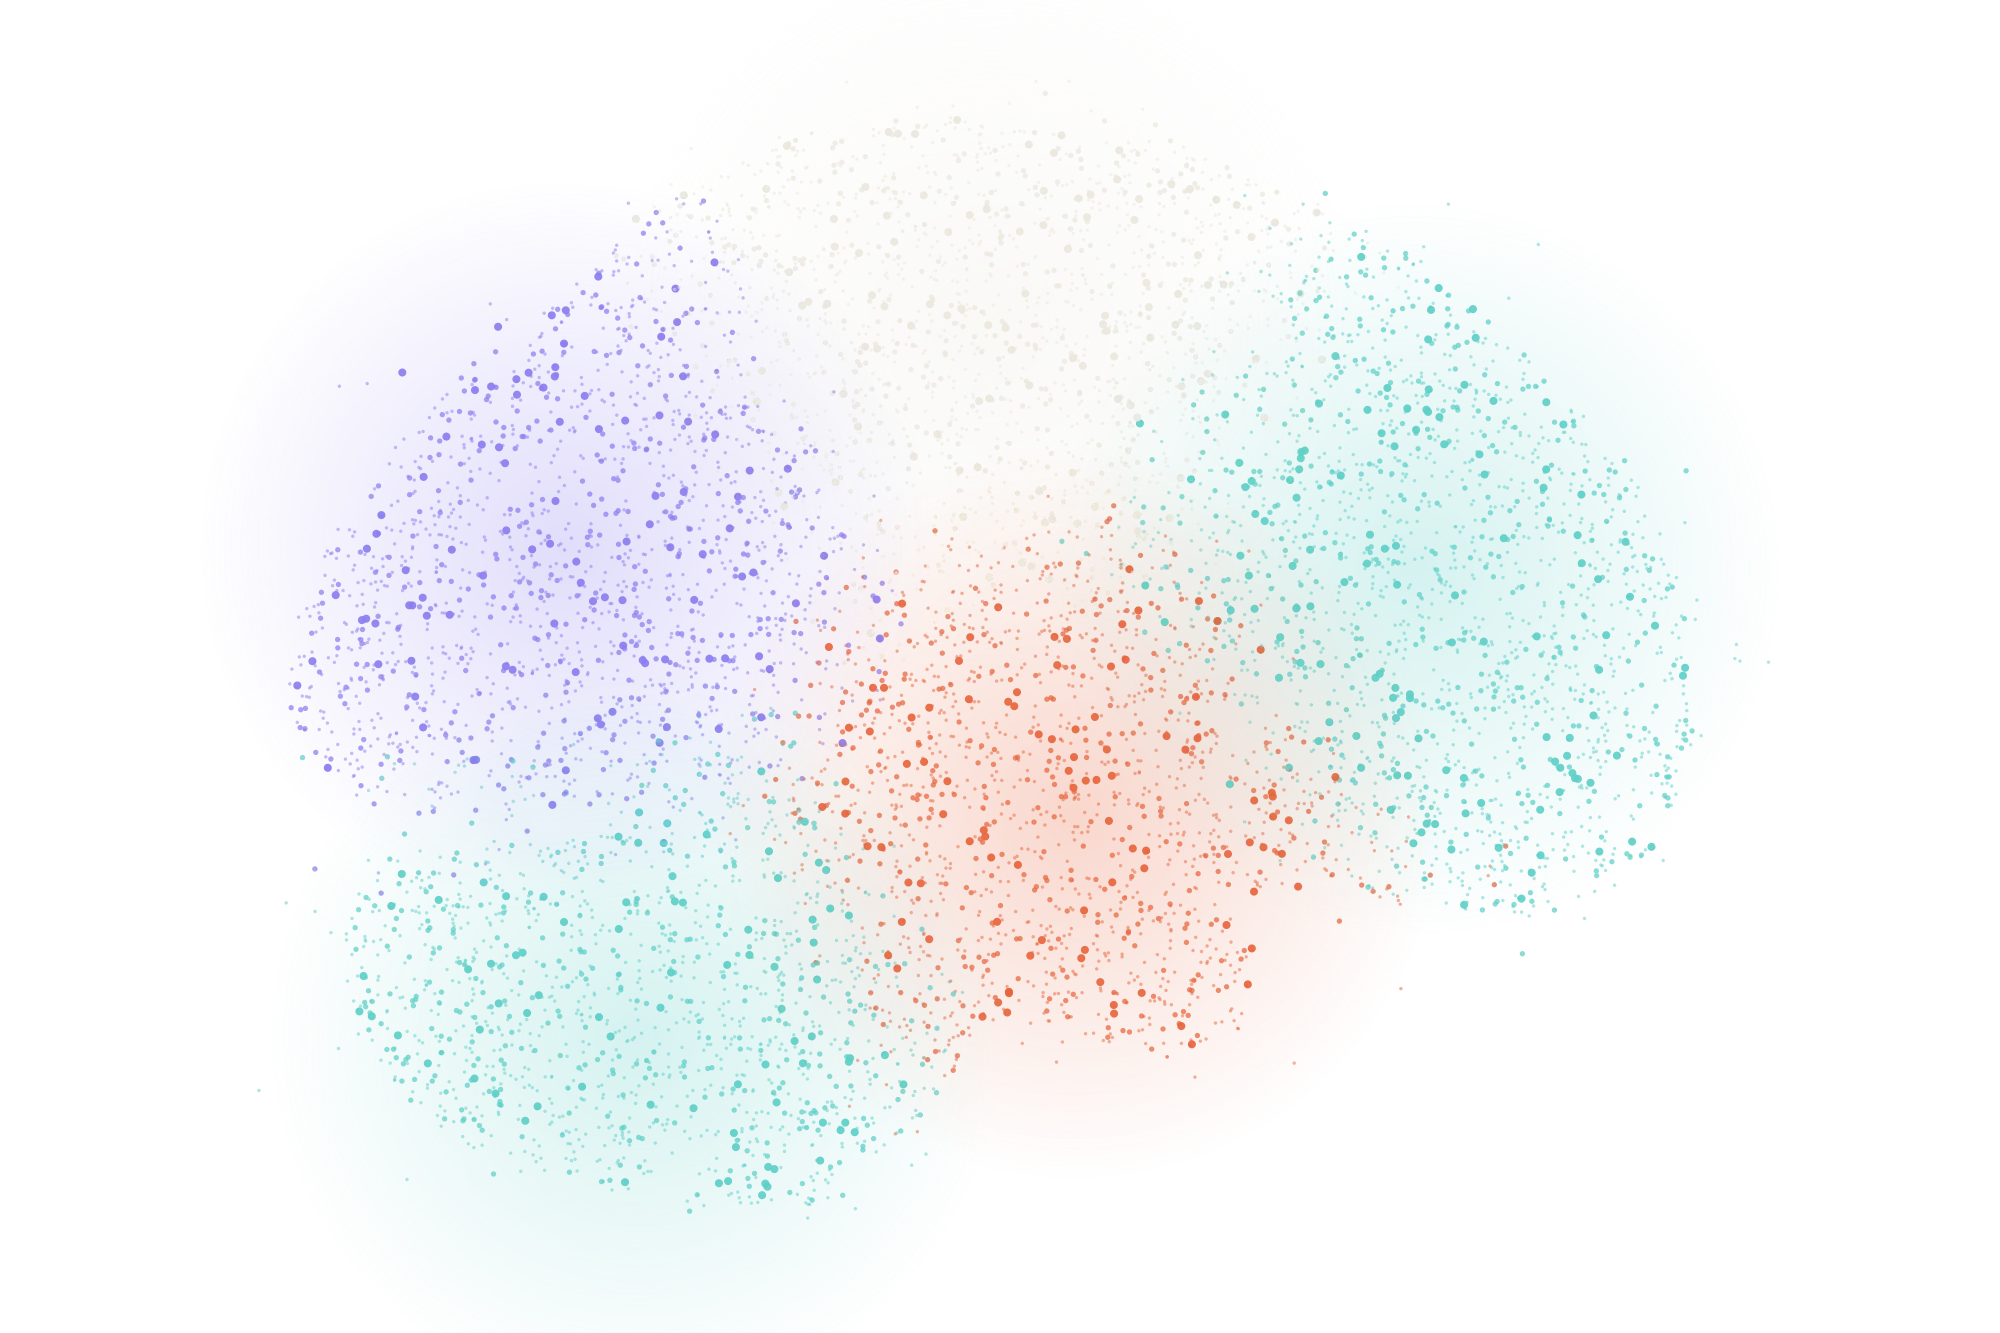
    The clouds: thousands of synthetic personas.

    • 1 · Demographicschanges over yearscensuses and household surveys
    • 2 · Home & workchanges over monthshousehold and employment surveys
    • 3 · Values & attitudeschanges over monthssurveys and studies
    • 4 · Consumptionchanges over weekspanels, sales and CRM
    • 5 · Social & mediachanges over daysonline conversation, always aggregated
    • Around · Her realityarrives every dayprices, utility rates, roadworks, weather and safety in her area
  3. 03 · Test

    We test your versions.

    Each synthetic persona sees your message and tells us what it would choose, how it feels and why. It does this once with your message and once without it, separately: the difference is what your message achieved.

    // Method silicon sampling (Argyle et al., 2023, Political Analysis) · paired design in independent conversations · each profile estimates how 100 people like it would split (Meister, Guestrin & Hashimoto, 2024) · factorial design (Hainmueller, Hopkins & Yamamoto, 2014) · AI assumptions disclosed · preregistration with timestamp and fingerprint

  4. 04 · Calibrate & validate

    We correct and check against real people.

    A synthetic audience tends to answer in a balanced way, paying close attention to the message and its variants. Real people have emotions, often don’t care about the message, and change their minds over time. That’s why we compare it with real surveys and tests: we correct where it’s wrong and check how often it’s right. Every study learns from the last one and makes the synthetic audience more accurate.

    // Method level correction against the total of a real survey: the margin per group drops from ±14 to ±9 points · prediction-powered inference, PPI++ (Angelopoulos et al., 2023, Science; Angelopoulos, Duchi & Zrnic, 2023), applied to AI panels (Broska, Howes & van Loon, 2025): the margin is never worse than the survey’s alone · effect-size factor against real experiments (Ashokkumar et al., 2026, Nature) · validation: margin measured on data not used for fitting, and forecasts sealed before the outcome · re-checked with every new model version (Bisbee et al., 2024)

  5. 05 · Anticipate & decide

    You see the result before you launch.

    In your Deep Brain Voice dashboard you see how each group will react: which version wins, in which areas, where it meets pushback and how confident we are. And you can ask it anything you need.

    // Includes report · “what if…?” scenarios · what would have happened without your campaign, using your sales or complaints history

    // Method multilevel regression and poststratification, MRP (Gelman & Little, 1997; Park, Gelman & Bafumi, 2004) · uncertainty bands validated on 200 simulations with a known effect (Talts et al., 2018) · a brake on false winners (Gelman, Hill & Yajima, 2012) · decision-making under uncertainty (Thompson, 1933; Wald, 1950; Raiffa & Schlaifer, 1961)

// The engine

the Neural,iA brain.

Six stages that take you from your country's official data to a decision. The first five follow an order; the sixth, measuring the error, runs through all of them.

01 · Population & territory

// Population synthesis from official data

A made-up audience gives made-up answers.

Every synthetic persona is born from your country's official data.

Official data, like the census, the household survey or public records, tell you how many people live in each area and what they're like: how old they are, how far they went in school, whether they work, what their home is like. We build your synthetic audience from that information and keep the combinations exactly as they occur in real life. If four in ten women in a neighborhood live in homes with no sewer connection, so do four in ten in your synthetic audience.

We also tell each persona what their day-to-day is like, for example that their street floods when it rains. We never give them their neighborhood's percentage, because nobody thinks about their life in those terms.

Example · a neighborhood of 100 people
Sewer accessNo sewer accessWomen
20
40
Men
10
30
// 40 synthetic personas from this neighborhood

// Methods
  • Systematic sampling, probability proportional to sizeWe pick people by moving through the population in order, at fixed intervals. That way every combination of sex, age and area gets its fair share.
  • Per-area minimum and design weightsIf the study includes a map, each area gets at least about twenty people so it can be read on its own. Then each person is weighted so the total stays true.
  • Imputation with hierarchical smoothingHousehold income comes from the household survey. When a group has few cases, it leans on a broader group so it doesn't exaggerate.
  • Bernoulli trial per areaWhat people live through in their neighborhood, like a street that floods, is assigned person by person at that area's real rate.
  • Areal interpolationMoves data from the official areas to the neighborhoods or districts your team works with, according to how much territory they share.
  • Iterative proportional fitting (raking)For sources that only publish totals, like some countries' statistics or a brand's customer base. Deming and Stephan, 1940.
02 · The answers

// Synthetic sampling with language models, distributional elicitation and paired design

Ask AI for a single answer and it erases everyone who thinks differently.

Each persona imagines a hundred people like them, and hears your message separately.

Ask an AI to pick one option and it tends to settle on the most typical answer for that profile, so the doubters and the people against it disappear. That's why we ask for something else: to imagine a hundred people like that and tell us how they would split across the answers.

To measure your message, each persona answers twice, in separate conversations that don't remember each other: once without the message and once with it. The difference between the two is the effect. If the AI has a bias of its own, it shows up in both answers and cancels out when you subtract.

Example · one profile
// Profile

Man, 42, didn't finish high school. Lives on the outskirts of the city, in a home with no sewer connection.

What do you think of your city's public works plan?

  • Strongly approve52
  • Somewhat approve28
  • Somewhat disapprove12
  • Strongly disapprove8

Example · the same persona, two conversations
Without your message56
With your message64
  • Baseline answer
  • What your message moves
  • AI bias
  • What real people would answer
Message effect+8It doesn't matter how biased the AI is, as long as the bias is the same in both conversations.

// Methods
  • Profile-conditioned synthetic samplingA language model answers as each synthetic persona, based on their profile. Each simulation uses one fixed model, and we record which one. Argyle et al., 2023.
  • Distributional elicitationInstead of one vote, a split of a hundred. That brings out the extremes and the undecided that a single answer leaves out. Meister, Guestrin and Hashimoto, 2024.
  • Paired counterfactual designEach persona is compared with itself, with and without the message. So it doesn't matter if one group happened to get more young people than another.
  • Structured output with validationEvery split has to add up to a hundred and explain what the model assumed. Anything that doesn't is rerun or logged.
  • Reading the tail of the distributionThe part of the split that strongly rejects works as an early warning of anger, and helps group each segment's objections.
03 · Multilevel engine

// Bayesian multilevel regression and poststratification (MRP)

With few cases, any number can fool you.

Small groups lean on similar ones, and everything is projected onto the real population.

With four synthetic personas in a neighborhood, the result can jump from 30% to 95% by pure chance. The multilevel model combines what that neighborhood says with what similar neighborhoods and groups say: the more cases it has, the more the model trusts it; the fewer, the more it leans on the rest and the wider its margin. In the end, each combination of area and profile carries the weight it has in the population, according to official data.

Example · one neighborhood
Neighborhood cases only
Neural,iA, leaning on similar groups
  • Average of similar groups: 48%
  • True value in this example: 62%
Trust in the neighborhood29%
Margin, neighborhood only±21
Neural,iA margin±11

// The math estimate = w × neighborhood + (1 − w) × similar groups. The weight w grows with the number of cases in the neighborhood.

// Methods
  • Hierarchical model with partial poolingEach area, age, education level and sex has its own effect, and so does the message depending on who it reaches. Groups share information with each other. Gelman and Hill, 2007.
  • Dirichlet-multinomial likelihoodReads each full split and estimates how much information it really carries: one split isn't worth a hundred surveys.
  • Multinomial logit and ordinal logistic regressionThe model works on an unbounded scale, so no result can come out below 0% or above 100%.
  • Hamiltonian Monte Carlo with NUTSExplores 9,000 possible combinations of the parameters. Before showing a result, we check that the computation has converged. Hoffman and Gelman, 2014; Vehtari et al., 2021.
  • PoststratificationEach combination of area and profile carries the weight it has in the real population. Gelman and Little, 1997; Park, Gelman and Bafumi, 2004.
  • 80% and 90% credible intervalsEvery number comes with its margin. An effect is highlighted only if its 90% margin doesn't cross zero.
04 · Calibration

// Anchoring with real data: level correction and prediction-powered inference

An AI is not the real world.

We anchor it with a real survey.

Even with everything before done right, the AI can keep leaning the same way, because it fills in what it doesn't know with the group's stereotype. A real survey corrects that lean: the survey sets the overall level and the synthetic audience brings the differences between groups, which a small survey can't see.

Example · five age groups
  • Synthetic audience
  • Real survey
  • Before correction

// Methods
  • Level correction against the totalEach group is corrected by the same amount the total was off. In our tests, the margin per group went down from 14 to 9 points.
  • Prediction-powered inference (PPI++)Builds a synthetic twin of each respondent and decides how much to trust them. In the worst case, the margin is the survey's alone. Angelopoulos et al., 2023; Angelopoulos, Duchi and Zrnic, 2023.
  • Kish effective sample sizeWorks out how many cases really count when they don't all carry the same weight. Kish, 1965.
05 · Your data on the map

// Spatial integration on a common grid and overlay matrix

Knowing how people react isn't enough: where matters too.

Your BI layer, area by area. What people live with in their neighborhood reaches the agent; the figures stay on your dashboard.

Your business or operational data (sales by point of sale, roadworks, complaints) is placed on the map and counted by area. From there it does two different jobs. What a person lives with in their neighborhood, like having no branch nearby or roadwork on their street, is added to their profile and changes how they take your message. The figures nobody sees in daily life, like market share or complaint rates, aren't shared with the agent: if we told it, the AI would repeat them as if they were its own opinion. Those figures are cross-referenced later, on the dashboard, against each area's reaction.

No data gets in on a hunch. A piece of local data is added to the profile only if, when tested, it brings the synthetic audience closer to what happens in reality. When we tested each neighborhood's street trees, it didn't: the model already knew what each neighborhood was like from its name.

Example · your BI layer in 32 areas

// The math a piece of local data enters the profile only if it brings the synthetic audience closer to each area's real data (Spearman correlation, with a 90% margin)

Example · the overlay on your dashboard

// The math everything on the same grid: your data by area, per 1,000 residents, against how much your message moves opinion in that area

// Methods
  • Common grid by areaAll real data is brought to the same territorial division and expressed per 1,000 residents, so large and small areas can be compared.
  • Geocoding without addressesEach branch, roadwork or complaint is placed on the map and counted in its area, and the address is discarded.
  • Context test with Spearman correlationBefore adding data to the profile, we check whether it brings the synthetic audience closer to each area's reality. If it doesn't, it stays out.
  • Overlay matrixOverlays what happens in each area with how its people react, and flags missed opportunities and sensitive areas.
06 · Measuring the error

// Validation: simulation-based calibration, fidelity testing and testing against experiments

A number without its margin of error can't support a decision.

We measure how far off each stage is, and we show you.

This stage runs alongside all the others. No method guarantees being right every time; what we can guarantee is knowing how far off each part is. Every test sets its criterion before it runs and has to beat a simple rule. If it doesn't, that method isn't used.

Example · 100 simulations with a known answer
  • The 90% margin includes it
  • It doesn't
Hits90 of 100expected: between 85 and 95

// The math hits = times the margin includes the correct answer ÷ simulations. Over 200 simulations: 90.5% on multiple-choice questions and 91.5% on scales.

// Methods
  • Simulation-based calibrationWe simulate cases where we know the answer and check that the 90% margin includes it between 85 and 95 times out of 100. Talts et al., 2018.
  • Twin fidelity testWe compare each real respondent with their synthetic twin: whether the groups land in the same order, how similar the distributions are and how often it gets it right, person by person.
  • Split-half validationWe compute the margin with half of the respondents and test it against the other half, 200 times.
  • Testing against published experimentsWe replicate real experiments and compare the direction, order and size of the effects, with the criterion set in advance.
  • A simple rule to beatNo method gets in unless it beats the simplest alternative.
// What we've measured

accuracy is proven, not promised.

  • ±14 / ±9

    With the synthetic panel alone, no fieldwork, each group gets a range of ±14 points. Anchored to the total of a real survey, ±9.

  • 9 in 10

    And those ranges hold: 9 times out of 10, they contain what real people answered.

  • 13 of 13

    We replicated 11 published experiments from Latin America. In all 13 clear shifts in opinion, we called which way people moved: 13 of 13.

proven statistics, frontier AI.See all 29 studies

The statistical methods have decades of use and validation behind them. Using language models as survey respondents is a new field, dating from 2023, with promising results and documented limits. We cite both.

Statistics and sampling

  • Deming and Stephan (1940) Annals of Mathematical StatisticsIterative proportional fitting.
  • Kish (1965) Survey SamplingSample design and effective sample size with weights.
  • Efron (1979) Annals of StatisticsThe bootstrap.
  • Beckman, Baggerly and McKay (1996) Transportation Research ASynthetic populations built from official data.
  • Gelman and Little (1997) Survey MethodologyMultilevel regression and poststratification (MRP).
  • Park, Gelman and Bafumi (2004) Political AnalysisMRP for estimates by territory.
  • Gelman, Hill and Yajima (2012) Journal of Research on Educational EffectivenessMany comparisons without false winners.
  • Wang, Rothschild, Goel and Gelman (2015) International Journal of ForecastingMRP with non-representative samples.
  • Talts et al. (2018) arXivValidating models with simulations of a known effect.
  • Vehtari et al. (2021) Bayesian AnalysisConvergence diagnostics.

Synthetic panels with AI

  • Argyle et al. (2023) Political AnalysisA model conditioned on profiles reproduces how groups respond.
  • Angelopoulos et al. (2023) ScienceValid inference from many predictions and little real data.
  • Angelopoulos, Duchi and Zrnic (2023) arXivPPI++: how far to trust predictions without losing validity.
  • Horton, Filippas and Manning (2023) NBER (MIT)Language models as simulated economic agents: Homo silicus.
  • Bisbee et al. (2024) Political AnalysisThe limits: less variation than real people, and shifts between model versions.
  • Meister, Guestrin and Hashimoto (2024) StanfordAsking for the distribution describes a group better than adding up single answers.
  • Park et al. (2024) StanfordAgents built on real data are more faithful than those built on demographics alone.
  • Manning, Zhu and Horton (2024) MIT and HarvardThey get the direction of effects right, not their size.
  • Broska, Howes and van Loon (2025) Sociological Methods & ResearchReal and synthetic respondents in a single design.
  • Ashokkumar, Hewitt, Ghezae and Willer (2026) NatureAcross 70 experiments, predictions closely track real effects but overstate their size.
  • Pew Research Center (2026) Data LabsSimulated copies of real respondents were off by 12 points on average: they don't replace a survey.

For decisions

  • Thompson (1933) BiometrikaThe probability that one option beats another.
  • Wald (1950) Statistical Decision FunctionsDeciding with the worst case in mind.
  • Raiffa and Schlaifer (1961) Applied Statistical Decision TheoryDeciding under uncertainty.
  • Howard (1966) IEEEThe value of knowing more before you decide.
  • Hainmueller, Hopkins and Yamamoto (2014) Political AnalysisWhat each part of an option contributes.
  • Russo et al. (2018) Foundations and Trends in Machine LearningSpreading tests across options as results come in.
  • Offer-Westort, Coppock and Green (2021) American Journal of Political ScienceAdaptive experiments for testing many messages.
  • Das, Kong, Sen and Zhou (2023) Google ResearchThe “if you do nothing” baseline for series with a history.
// Use cases
Campaigns · Launches · Content

how does your audience feel about each message?

We test your messages on your synthetic audience, segment by segment: by territory, socioeconomic level, culture and lifestyle. You go to market with the message that moves people.

Governments · National and local

which projects and policies do people value?

We estimate how each area sees your administration, and who gets the credit. You know what to say, where and to whom.

Brands · Products

what happens if I change the price?

We compare concepts and prices on your synthetic audience, without weeks of fieldwork. You decide before you invest.

// Platform access

explore it from the inside.

Leave your name and email and we'll send you a personal link to walk through the methodology and the data layer. It lasts 24 hours; when it expires, just request another.

Would you rather we show you?

A PQ Agency platform · Built with Ethernaly
// Want to know more?

let's talk.